curve_bspline
Draw a B-spline curve through control points
curve_bspline(
    points,
    [segments=100],
    [close=false],
    [weights],
    [draw=true],
    [stroke=#000000],
    [fill=#FFFFFF],
    [weight=1.00]
)
Draw a B-spline curve through control points
Syntaxe
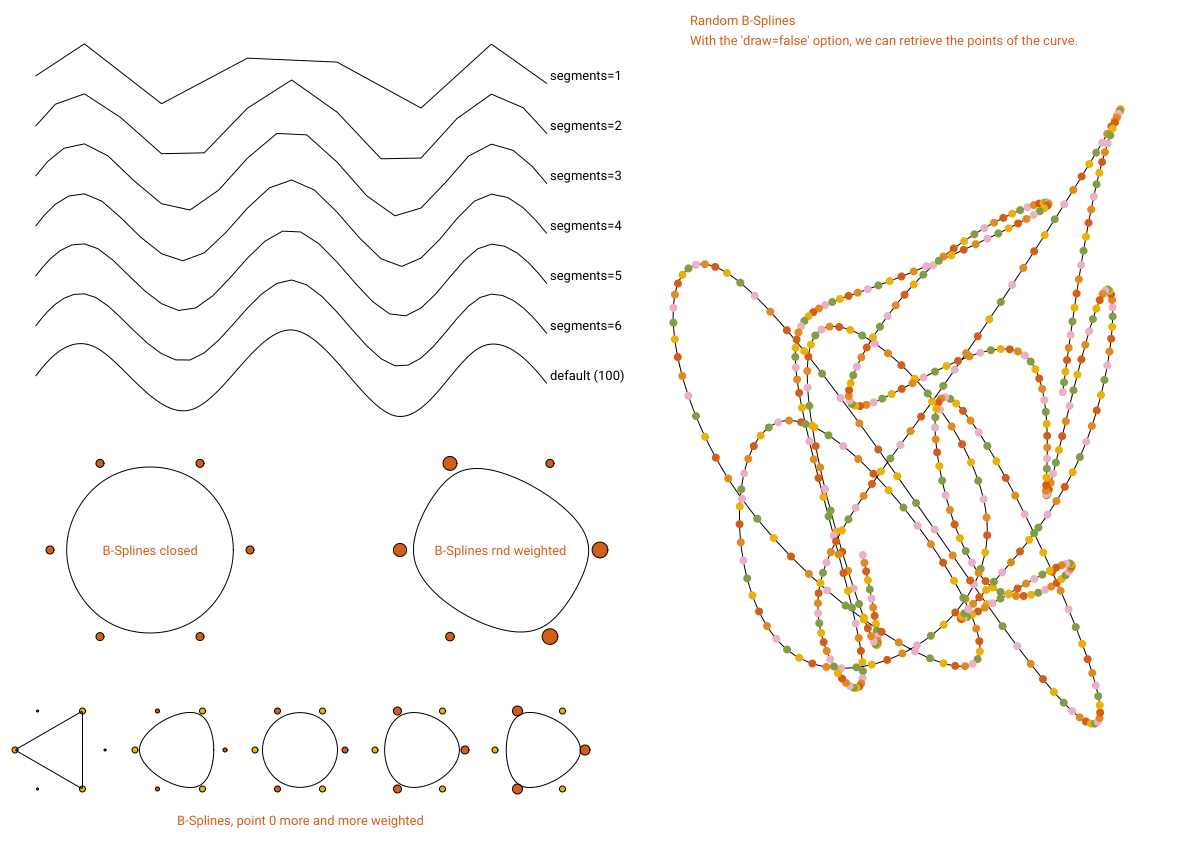
curve_bspline([25,160, 90,75, 155,160, 220,75], segments=100, stroke="#000");
Arguments
| Name | Type | Required | Default | Description |
|---|---|---|---|---|
points | yes | - | Flat array of control points [x1,y1, x2,y2, ...] | |
segments | - | 100 | Number of segments per control point | |
close | - | false | Close the curve | |
weights | - | - | Array of weights for each control point | |
draw | - | true | Draw the curve (true) or return points (false) | |
stroke | - | #000000 | Stroke color | |
fill | - | #FFFFFF | Fill color | |
weight | - | 1.00 | Stroke weight (thickness) |
Full example
var palette = ["#EAB1C6", "#E9B109", "#E18A1F", "#829D44", "#D35E17"];

canvas(1200, 850);
font_default(size=13);

var points = [25,160 ,90,75, 190,245, 290,25, 400,255, 480,70, 560,170];
coord_open();
coord_translate(0,-70);

for (var i=0; i<6; i++) {
    var seg = 1+(i) ;
    curve_bspline(points, segments=seg);
    text("segments="+seg, 550, 150);
    coord_translate(0,50);
}
curve_bspline(points);
text("default (100)", 550, 150);
coord_close();


coord_open();
coord_translate(0,300);

var cx = 150;
var cy = 250;
var r = 100;
points=[];
var points_weight=[];
for (var i=0; i<6; i++) {
    var x = cx + r * cos(i/6 * TAU);
    var y = cy + r * sin(i/6 * TAU);
    points.add(x,y);
    circle(x,y,4, fill=palette[4]);
}
curve_bspline(points, close=true, fill="transparent");
text("B-Splines closed", cx,cy, ax=middle, ay=middle,  fill=palette[4]);


cx = 500;
points=[];
points_weight=[];

for (var i=0; i<6; i++) {
    var x = cx + r * cos(i/6 * TAU);
    var y = cy + r * sin(i/6 * TAU);
    var w = randfloat(0,2);
    points.add(x,y);
    points_weight.add( w );
    circle(x,y,2+(3*w), fill=palette[4]);

}
curve_bspline(points, weights=points_weight, close=true, fill="transparent");
text("B-Splines rnd weighted", cx,cy, ax=middle, ay=middle,  fill=palette[4]);


cx = 60;
cy = 450;
r = 45;
var spacing = 30;
for (var j=0; j<5; j++) {
    points=[];
    points_weight=[];
    for (var i=0; i<6; i++) {
        var x = cx + r * cos(i/6 * TAU);
        var y = cy + r * sin(i/6 * TAU);
        var w = 1;
        var c = palette[1];
        points.add(x,y);
        if (i%2==0) {
             w = j*0.5;
             c = palette[4];
        }
        points_weight.add( w );
        circle(x,y,1+(2*w), fill=c);
    }
    curve_bspline(points, weights=points_weight, close=true, fill="transparent");
    cx += spacing + r*2;
}
text("B-Splines, some points are more and more weighted", 300,520, ax=middle, ay=middle,  fill=palette[4]);
coord_close();

randseed(123456);
spacing = 20;
points=[];
for (var i=0; i<30; i++) {
    var x = randfloat(650, width()-spacing);
    var y = randfloat(spacing, height()-spacing);
    points.add(x,y);
    // circle(x,y,4, fill=palette[4]);
}
curve_bspline(points, fill="transparent", segments=100);

var bs = curve_bspline(points, draw=false, segments=100);
for (var i=0; i<bs.length; i+=12) {
    cx = bs[i];
    cy = bs[i+1];
    circle(cx,cy,4, stroke=palette[i%palette.length], fill="transparent");
}
text("Random B-Splines", 690,spacing, ax=start, ay=middle,  fill=palette[4]);
text("With the 'draw=false' option, we can retrieve the points of the curve.", 690,spacing*2, ax=start, ay=middle,  fill=palette[4]);


save(whoami(png=true));

var p = curve_bspline(points, segments=4, draw=false);
console(p); // [25, -15.9807621135, 40, 10, 25, 35.9807621135, ...]