lerp_line_point
Return one point distributed along a line, at a certain moment
lerp_line_point(
    x1,
    y1,
    x2,
    y2,
    amount
) -> List of 2 coords [x,y]
Return one point distributed along a line, at a certain moment
Syntaxe
var list = lerp_line_point(x1=10, y1=10, x2=20, y2=20, amount=0.65);
Arguments
| Name | Type | Required | Default | Description |
|---|---|---|---|---|
x1 | float | yes | - | x-coordinate of the first point |
y1 | float | yes | - | y-coordinate of the first point |
x2 | float | yes | - | x-coordinate of the second point |
y2 | float | yes | - | y-coordinate of the second point |
amount | float | yes | - | Normalized position along the line (between 0 and 1) |
Full example
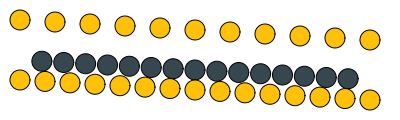
canvas(width=400, height=120);
var col1 = "#FFC107";
var col2 = "#37474F";

for (var i = 0; i<1; i+=0.1) {
    var pt = lerp_line_point(x1=20, y1=20, x2=370, y2=40, amount=i);
    circle(x=pt[0], y=pt[1], radius=10, fill=col1);
}

var pts = lerp_line_points(x1=20, y1=60, x2=370, y2=80, count=15);
for (var i = 0; i<pts.length-1; i+=2) {
    var x = pts[i];
    var y = pts[i+1];
    circle(x=x, y=y, radius=10, fill=col2);
}

pts = lerp_line_points(x1=20, y1=80, x2=370, y2=100, count=15, include=true);
for (var i = 0; i<pts.length-1; i+=2) {
    var x = pts[i];
    var y = pts[i+1];
    circle(x=x, y=y, radius=10, fill=col1);
}

save(whoami(png=true));